Philosophy
April 25, 2023 2026-06-11 11:27Philosophy
Investment Philosophy
Navigating the inevitable cycles of the market with insight, discipline, and durability.
The perception of investors is often characterised by a linear thought process. But in reality, nothing of consequence goes up or down in straight lines — they operate in cycles. It is not only various market capitalization indices and sectors that exhibit cyclical behavior, but also individual companies experience them over time.
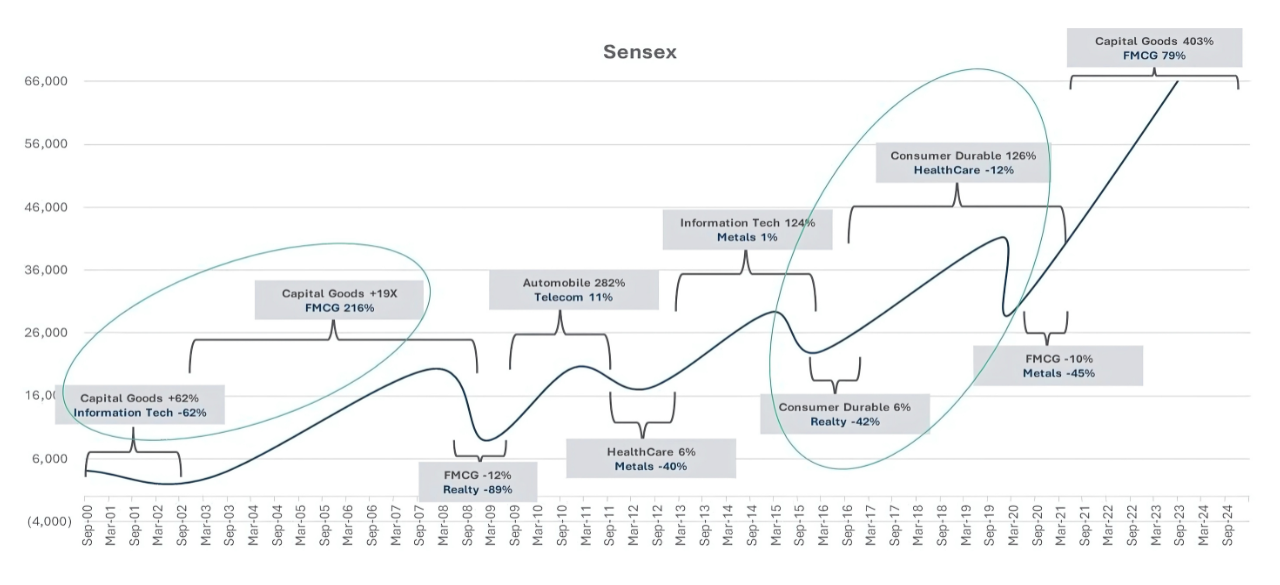
Source: Bloomberg, Buoyant Capital analysis.
Past performance is not indicative of future results. The index details are for representational purposes only and are not investment recommendations. The portfolio manager may or may not have exposure to the sectors or stocks represented in the index.
Past performance is not indicative of future results. The index details are for representational purposes only and are not investment recommendations. The portfolio manager may or may not have exposure to the sectors or stocks represented in the index.
Perception vs. Reality
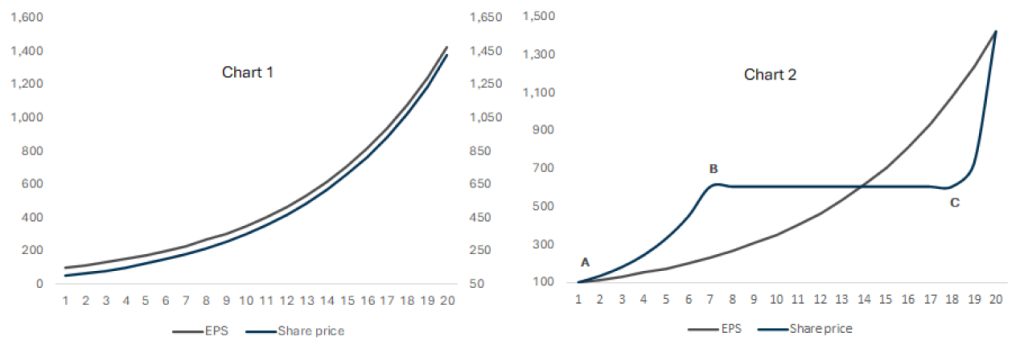
To illustrate this, consider the two charts below. They compare:
(a) the growth of a company’s fundamental value (measured through EPS growth), and
(b) the growth in the company’s share price over time.
(a) the growth of a company’s fundamental value (measured through EPS growth), and
(b) the growth in the company’s share price over time.
The left chart reflects a typical investor’s perception — that a company delivering consistent earnings growth (say, 20% annually) should see its share price rise at a similar rate each year.
The right chart shows how markets behave in reality. Initially, the discovery of a high-quality company drives its stock price up faster than its fundamentals (Point A to B). Eventually, the market realizes it is overpaying for future growth, leading to a prolonged period where the fundamentals keep rising, but the share price remains flat (Point B to C). This sideways phase can last a decade or more.
Source: Bloomberg, Buoyant Capital analysis.
Past performance is not indicative of future results. The index details are for representational purposes only and are not investment recommendations.
Past performance is not indicative of future results. The index details are for representational purposes only and are not investment recommendations.
Because indices, sectors, and companies all move through cycles, we believe the most effective investment strategy is to invest in alignment with these cycles.
At Buoyant, our fund management philosophy revolves around understanding these sectoral and business cycles deeply. Our goal is to deliver higher risk-adjusted returns over the long term, by adapting our strategy to where we are in the cycle.
We implement this through two complementary approaches:
- An aggressive stance when aiming for higher returns
- A defensive stance when the focus shifts to reducing risk
This involves dynamic allocation between our Core and Satellite portfolios, adjusting weights based on market conditions and opportunities.
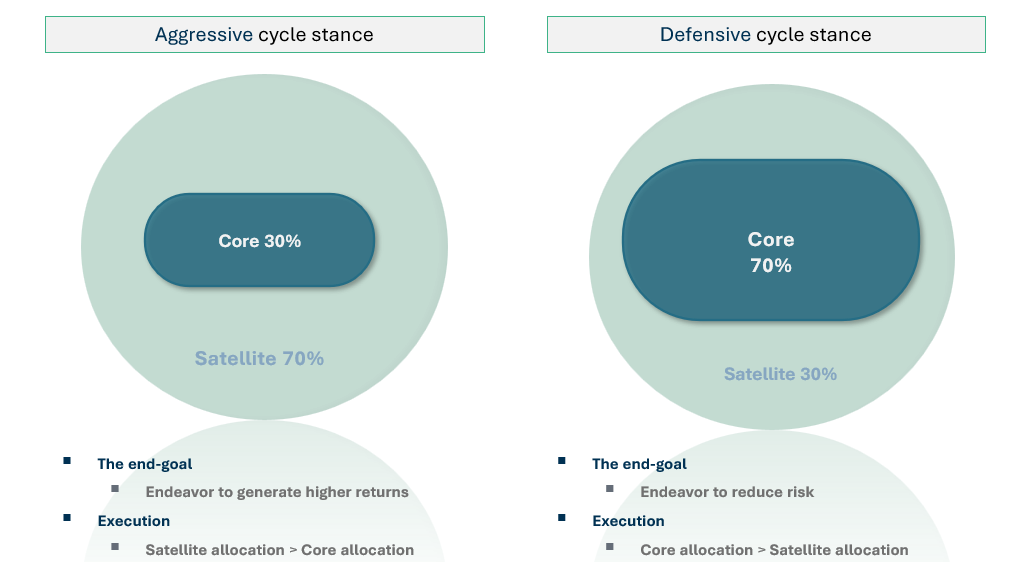
Note: The weights are suggestive, and may change based on fund manager’s discretion, based on market conditions.
Executing this strategy requires insight, discipline, and a strong understanding of the forces driving different phases of the cycle.
How We Approach Fund Management
1
Research
Buoyant’s operational structure differs from that of most investment managers in that it consists of three portfolio managers – Sachin, Jigar, and Viral – also the company’s co-founders. Each oversees specific sectors they have tracked over the past two decades. This approach has historically eliminated familiarity bias.
2
Non-model portfolio
Our philosophy is that managed accounts, such as a PMS, should not be operated as a model portfolio. With us, investors are not fully invested on the initial day. This structure enables investors to concentrate on crucial allocation decisions, rather than attempting to time the market.
3
Skin in the game
Buoyant Capital, along with its directors and their family members, co-invests in the fund through the alternative investment framework.
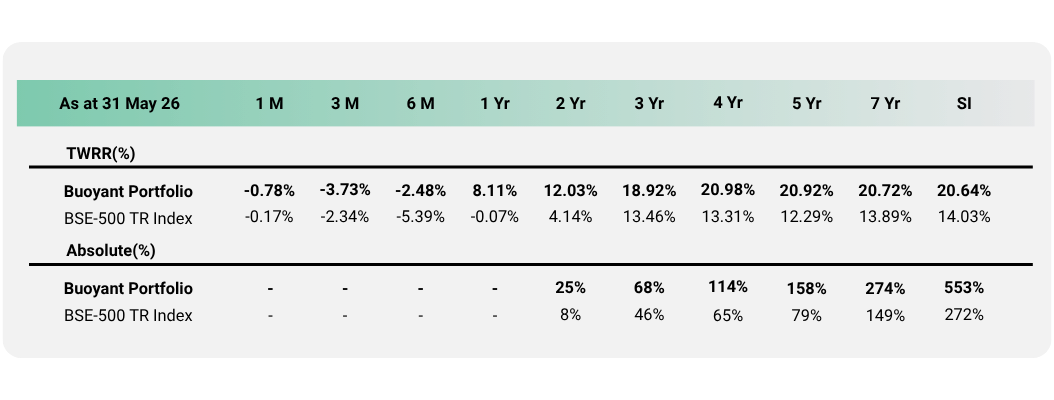
Track Record Since Inception (June 2016)
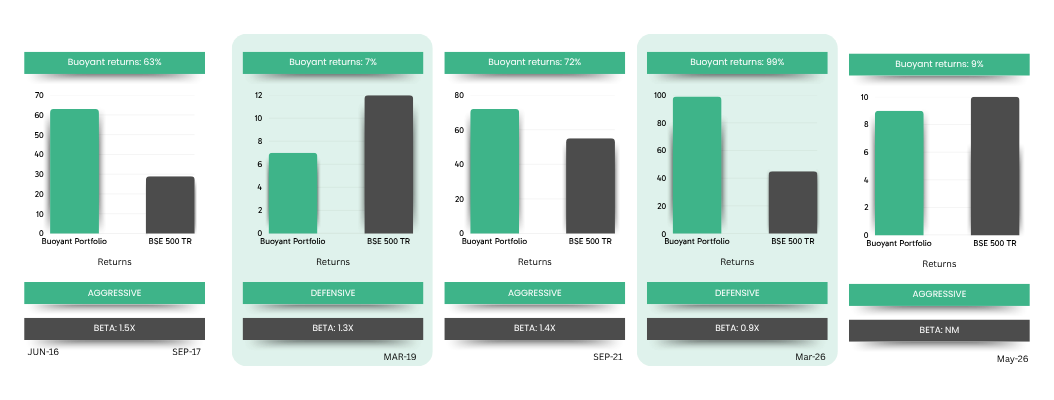
Source: Bloomberg, Buoyant Capital analysis.
The performance data for the Portfolio Manager and Investment Approach provided above has not been verified by SEBI. Performance data for periods up to 12 months is absolute; >12 months is TWRR. Net of expenses. Past performance is not indicative of future results.
The performance data for the Portfolio Manager and Investment Approach provided above has not been verified by SEBI. Performance data for periods up to 12 months is absolute; >12 months is TWRR. Net of expenses. Past performance is not indicative of future results.
Source: Bloomberg, Buoyant Capital analysis.
Past performance is not indicative of future results. The index details are for representational purposes only and are not investment recommendations.
Past performance is not indicative of future results. The index details are for representational purposes only and are not investment recommendations.